getTimeSeriesLab seperates original data into multiple time windows, and summarize statistical information.
plotWindowProportion(
  labData,
  idColName,
  labItemColName,
  dateColName,
  indexDate = last,
  gapDate = c(30, 90, 180, 360),
  topN = 10,
  studyPeriodStartDays,
  studyPeriodEndDays
)
Arguments
- labData
a file or dataframe of laboratory test data with at least 4 columns about patient ID, lab item, test value and test date, respectively.
- idColName
the column name that records patient ID in labData.
- labItemColName
the column name that records lab item in labData. If lab code is combined by multiple columns, then just simply add
+operator between column names, e.g.,A + B.- dateColName
the column name that records test date in labData. It should be in
"YYYYMMDD"/"YYYY-MM-DD"format.- indexDate
the specific date that used for cutting time window. It can be first record (
"first"), last record ("last"), any single date of interest with"YYYYMMDD"/"YYYY-MM-DD"format, or (indexTable), with ID and indexDate mapping table.- gapDate
desired period (in days) of each window interval. If
NULL, it will be seen as only one single time window.- studyPeriodStartDays
the expected start date of your study period, calculated by
indexDate+studyPeriodStartDays. For example, ifstudyPeriodStartDays=0, the start date of your study period will be theindexDate.- studyPeriodEndDays
the expected end date of your study period, calculated by
indexDate+studyPeriodEndDays. For example, ifstudyPeriodEndDays=360, the end date of your study period will be theindexDate+ 360 days.
Value
A data.table with statistical summary. By Individual means the proportion of individuals do not have any test result, By Window means the proportion of time windows do not have test results.
Details
This function is used for seperating lab data into multiple time windows, and it provides overall statistical information: total count, maximun value, minimun value, mean, nearest record to index date of each time window. If indexDate is first, then it will be the earliest test date among all the lab tests.
Examples
windowProportion <- plotWindowProportion(labData = labSample,
idColName = SUBJECT_ID,
labItemColName = ITEMID,
dateColName = CHARTTIME,
indexDate = first,
gapDate = c(30, 90, 180, 360),
studyPeriodStartDays=0,
studyPeriodEndDays=360
)
print(windowProportion$graph)
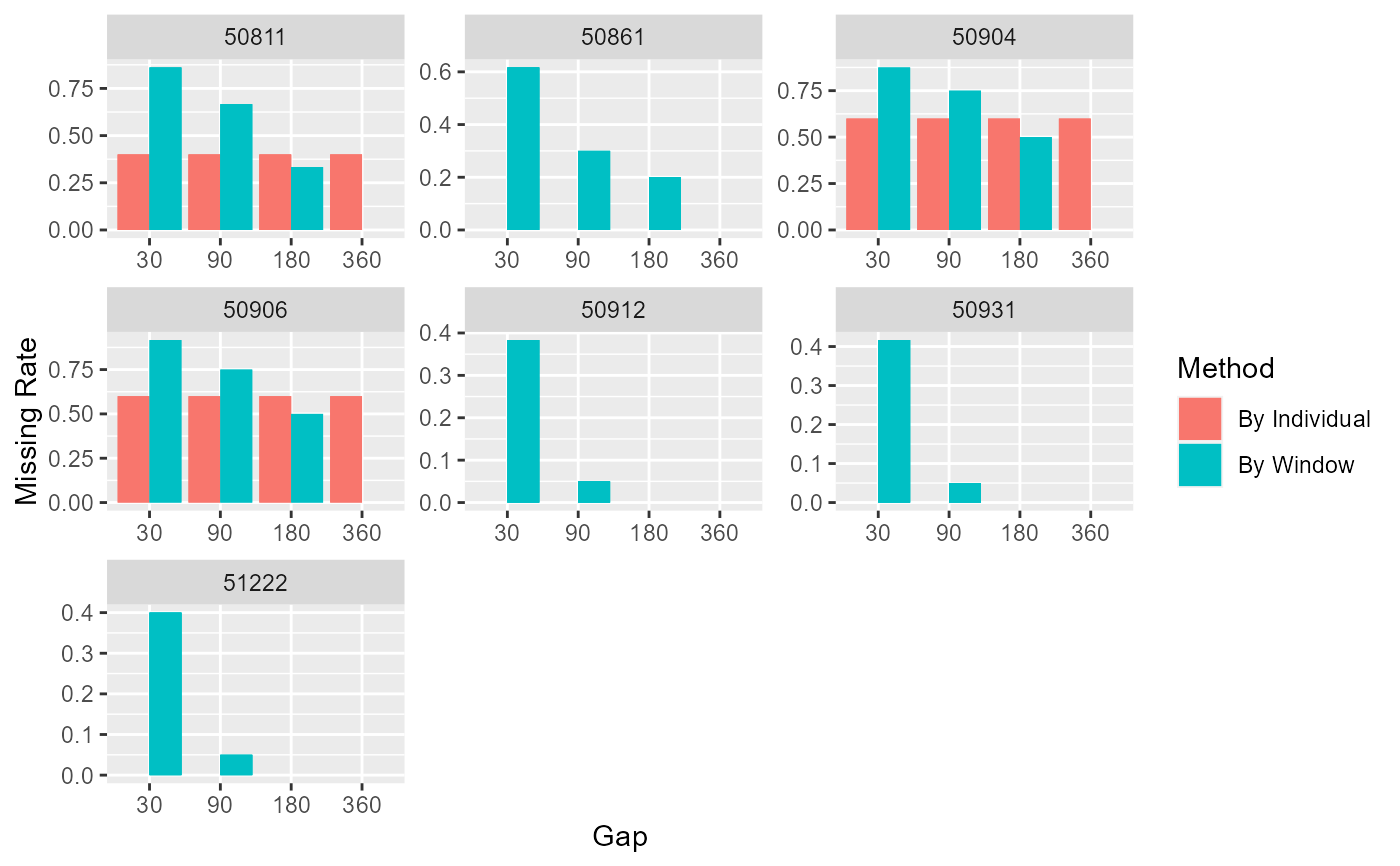 head(windowProportion$missingData)
#> LAB Gap Method Proportion
#> 1: 50861 30 By Individual 0
#> 2: 50861 30 By Individual 0
#> 3: 50861 30 By Individual 0
#> 4: 50861 30 By Individual 0
#> 5: 50861 30 By Individual 0
#> 6: 50912 30 By Individual 0
head(windowProportion$missingData)
#> LAB Gap Method Proportion
#> 1: 50861 30 By Individual 0
#> 2: 50861 30 By Individual 0
#> 3: 50861 30 By Individual 0
#> 4: 50861 30 By Individual 0
#> 5: 50861 30 By Individual 0
#> 6: 50912 30 By Individual 0